Core Web Vitals: what are they and how are they measured?

Core Web Vitals is a popular term in SEO communities and, more specifically in technical search engine optimization. However, a lot of people with an online presence and service or ecommerce sites haven’t heard of it.
So today we’re going into more details about what web core metrics are. We will also discuss how they are measured and why each of these metrics is important for online businesses and their users.

Image source: Unsplash.com
КWhat are Core Web Vitals?
Core Web Vitals are special technical metrics for evaluating website performance. The term and metrics were introduced by search engine leader Google, and their goal is to improve the overall user experience (UX) of a web page.
In other words, Google evaluates your website based on visitor satisfaction.
There are three main web metrics:
- Largest Contentful Paint (LCP) – loading speed;
- First Input Delay (FID) – interactivity or interaction time;
- Cumulative Layout Shift (CLS) – visual stability.
These three elements measure several critical aspects of the sites’ functionality and are a good indication of how users would rate their experience with the pages based on load time, ability to interact with the pages, and visual stability.
However, we need to examine them in detail to understand Core Web Metrics and the benefits of optimization.
What is Largest Contentful Paint (LCP)?
LCP is one of Google’s core web metrics. In general, it measures the loading speed of a web page.
Specifically, LCP is the time between opening a page and the largest (visual) element of its content fully loading. Such an element is most often an image, video, or main title. When this element loads, it is assumed that the main html content has also loaded and is now rendered for the user.
LCP can be influenced by many factors:
- The transfer time from a previously opened page to a new page (unload time);
- Time to establish the connection;
- Redirect time;
- Time to First Bite;
- Server caching;
- Render-blocking resources;
- External resources;
- Fonts used, etc.
However, these factors are varied, and optimizing them requires taking an in-depth, technically focused SEO course and working with web developers.
It is important to know, however, that they can significantly affect the LCP calculation and potentially worsen the final result in case they are not optimized. This increases the time it takes for the user to see the content on the page, which is a negative signal for search engines.
What is the ideal value of the LCP metric?
According to guidelines from Google Chrome developers, the ideal value for LCP is any equal to or less than 2.5 seconds to ensure users have quick access to the most important content.
Anything over 2.5 seconds requires optimization and work on various technical elements to improve this score. On the other hand, anything greater than 4.0 seconds is considered a truly unacceptable result, which often causes people to exit pages and results in a high Bounce Rate (BR).

Image source: Pexels.com
What is First Input Delay (FID)?
FID is another key metric, which refers to the “responsiveness” of the site. It can also be defined as the interaction time between a user and a page.
It is a metric of the time that takes between the first user interaction (e.g. clicking a button to add a product to a cart) and the browser response, i.e. when the action is actually performed.
The lower the FID number, the better the user experience in terms of page usability and the higher the customer engagement. *Important addition: FID will be replaced by Interaction to Next Paint (INP; explained below) in March, 2024.
What is the ideal value of the FID indicator?
An ideal FID value can be assumed to be any value that is less than 100 milliseconds. Such values are a sure sign that users can interact with your pages without delay, which also signals good website performance.
Any results over 100 milliseconds should be addressed to improve speed, and those over 300 milliseconds are an indication of a very poor experience when interacting with site features.
What is Cumulative Layout Shift (CLS)?
Cumulative Layout Shift, or CLS, is the third core metric of the so-called Core Web Vitals. It assesses a web page’s visual stability by measuring unexpected changes to its layout during the loading process.
Unforeseen changes in page layout refer to any unexpected or unplanned displacements of visual and interactive elements. These usually occur before the page has fully loaded and have a strong impact on the user experience.
You’ve probably experienced trying to click a button or menu on a web page before it’s fully loaded. The moment you do, another item loads in place of the button and you actually click on it instead of the one you wanted.
This is exactly the kind of interference that CLS aims to measure.
What is the ideal value of the CLS indicator?
The perfect CLS values are below 0.1, which generally means displacing site elements less than 10% of the visual section of the screen as they ensure a truly visually stable page layout. It means you’ll have satisfied users who are able to navigate to their desired locations on your site.
All scores between 0.1 and 0.25 demand your attention and signal that you need to improve your page experience. Values above 0.25 are an indication of a poor user experience and require timely action.

Image source: Unsplash.com
ЗначениThe importance of key web metrics for online business
At first glance, you may think that basic web metrics are just technical website parameters that affect web developers, not you. However, this is not the case.
Core Web Vitals is a structured framework developed to measure user satisfaction and effective web experience. That in itself means they are key for every online business owner and website developer.
If you want customers who are happy with your website, then you want good web metrics. But let’s look at their role in detail.
Important for users’ satisfaction
As mentioned earlier, web metrics measure user experience. However, it’s important to really look deep into this statement to see how crucial it actually is to the success of our website.
As a user, everyone wants a few basic things from a website:
- To be able to access its content quickly;
- To be able to interact with it when needed, and when they do;
- To get the right response to their query.
That’s what the core web metrics LCP, FID and CLS measure – do pages load quickly, are they responsive when interacting and are they stable during load time.
These factors are the foundation you need to build to ensure engaged and satisfied users who will continue to navigate your website.
Important for the website conversion rate
Core Web Vitals optimization contributes to lower bounce rates and greater user engagement success, thereby positively impacting conversion rates. Users are more likely to perform desired actions, such as making a purchase or filling out a form, when their interaction with the site is efficient and user-friendly.
In other words, optimizing these metrics relates to a higher number of sales and helps in the success of the business.
An important factor for ranking
Google considers the Core Web Vitals mentioned above when determining how well a site meets user expectations.
In fact, these metrics are one of the few known and major ranking factors in Google’s search results algorithm. That means that they are important from an SEO point of view, and good values contribute to your website being visible and accessible to users in organic search.
Online business owners who optimize their websites’ LCP, FID, and CLS have a greater chance of ranking at the top of Google and, therefore, reaching a larger audience.
Give you a competitive advantage
Although it is a consequence of the above, competitive advantage is another role that well-optimized metrics play.
First, users will find you easier than your competitors because search engines will prefer your site. Secondly, users themselves will be happy with the smooth and responsive experience on your site.
This improves brand awareness, which also contributes to increased trust and loyalty from users, which in turn increases your chances of converting them into customers.
So you’re already several steps ahead of your competitors.
Ways to measure key web metrics
Measure the key web metrics for your website to ensure optimal loading speed and user experience.
You can do this through various online LCP, FID and CLS testing tools. The good news is that Google has made sure you have free access to some of the most popular web metrics measurement tools.
Chrome User Experience Report (CrUX)
CrUX, or “Chrome User Experience Report,” is the official dataset of the Web Vitals program. It contains information on all the major web metrics.
CrUX is a convenient and reliable method to get real data on whether Chrome users are satisfied with the performance and interaction with your website.
You can also see other metrics besides the basic ones:
- First Paint (FP);
- First Contentful Paint (FCP);
- DOM Content Load;
- Onload;
- Interaction to Next Paint (INP);
- Experimental metrics such as Time to First Byte (TTFB) and Popularity rank.
Data can be accessed in various ways, specified in the CrUX guidelines from the Chrome developers.
PageSpeed Insights (PSI)
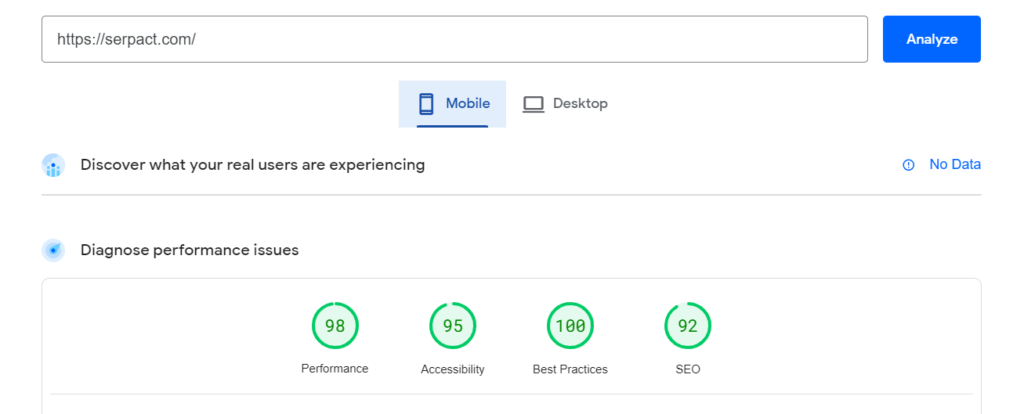
PageSpeed Insights is a Google web-based tool that enables you to measure your web metrics for free. To do so, enter your target URL and click the “Analyze” button.
The tool takes into account the user experience across both desktop and mobile and measures all the metrics you need, plus two additional ones we’ll talk about later.
This report gives you the following information:
- Performance – combines the results of all web metrics;
- Accessibility – assesses accessibility for visually impaired users;
- Best Practices – lets you know if your site meets the best and current web development practices;
- Search Engine Optimization (SEO) – displays information about whether your page is well optimized for search engines.
On top of all this, PSI also gives you suggestions on exactly how to improve your results.
Lighthouse
Lighthouse is another very helpful tool for analyzing and improving web metrics. Like PSI, it performs a series of audits and provides a final report on your site’s performance, accessibility, and other details.
You can use it in a way that is convenient for you:
- Through a browser extension;
- In Chrome DevTools;
- Through a terminal (command line);
- As a module in Node (Node module);
- From an online GUI (web UI).
Core Web Vitals Report
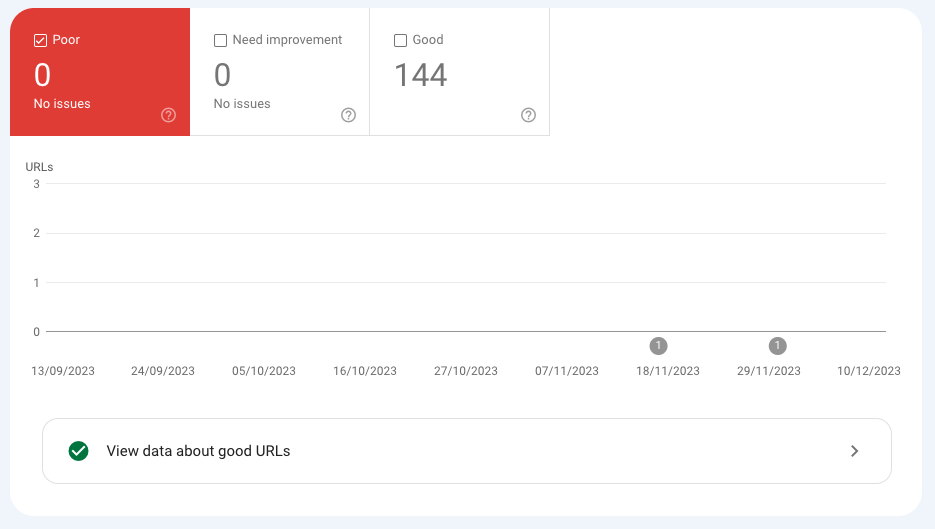
To identify issues and track improvements in web performance, you can also use the Google Search Console report, a tool that gives you a centralised view of your site’s performance.
You’ll find detailed information in the “Experience” report, under the “Core Web Vitals” subsection. In case there’s enough data available, you’ll find 2 reports there – for mobile and desktop. You can view each of them in detail by clicking “Open Report”.
The report provides you with a convenient way to see which URLs have the status “poor”, which ones need to be improved further, and which ones are performing well. You can prioritize work on recommendations based on their impact and ability to be implemented.
If the report displays a “No data available” message, then it probably takes a little longer for the Google Search Console to gather data to generate the report. This is often the case with new sites or those that are not yet generating enough traffic for a mobile or desktop version.
Other instruments
In addition to Google’s suggestions, other tools can help you receive insight into how users are finding your site. These include Web Vitals for Chrome and WebPageTest.
However, Google’s tools are preferred by many in the SEO industry, as they have proven their effectiveness over time.
We recommend using a combination of methods and never relying solely on automatically generated reports. Manual verification (interaction with the site) can give you a significantly different view of the same metrics.
Other metrics and speed indicators
After discussing the basic web metrics, it’s time to turn our attention to a few other, equally important metrics that also contribute to our overall understanding of site performance.
First Contentful Paint (FCP)
First Contentful Paint (FCP) is a metric similar to LCP, but instead of measuring the time to load of the largest element, it measures the time to load of any element on the page.
Time to Interactive (TTI)
Time to Interactive, or TTI for short, is a metric that measures the time from the start of loading to the actual loading of the main sub-resources of the page and the actual interactivity opportunity.
Total Blocking Time (TBT)
Total Blocking Time (TBT) measures the time between the FCP and the TTI that a page is unresponsive to user-entered data, i.e. when it has not been “responsive”.
Speed Index
The Speed Index is another additional metric that contributes to the final score in the “Performance” report in PSI and Lighthouse. The metric measures how quickly visible content is uploaded during page load.
Interaction to Next Paint (INP)
Interaction to Next Paint (INP) measures the time, or more precisely, the delay (latency) that takes between the moment of interaction with the page and the response to the request. This is done for all interactions, and then the “worst” performance is selected and displayed as the overall page response value.
*Important addition: INP will replace FID as the primary web metric in March, 2024.
Time to First Byte (TTFB)
Time to First Byte (TTFB) is a metric that measures the time the browser waits for a response from the server, and which is required to respond to the user request. Or put another way, the web browser sends the user request and waits to receive back the first byte of data as the server’s response. This is exactly what TTFB is.
The need for a holistic approach
The core web metrics are called “core” for a reason – LCP, FID and CLS are the most important in terms of user satisfaction and are an official ranking factor for Google, so optimizing them should be a priority.
However, a holistic approach should be present in your technical SEO checklist. A collective analysis of all metrics will provide you with a holistic picture and a real assessment of your site’s current state and user experience.