Google Page Speed Insights Major Update

A new change to Google Page Spedd Insights has occurred
There used to be one value for evaluating page optimization for mobile and desktop computers, now there are two. A PageSpeed Insight Optimization Score has already been added to the page load rate in seconds.
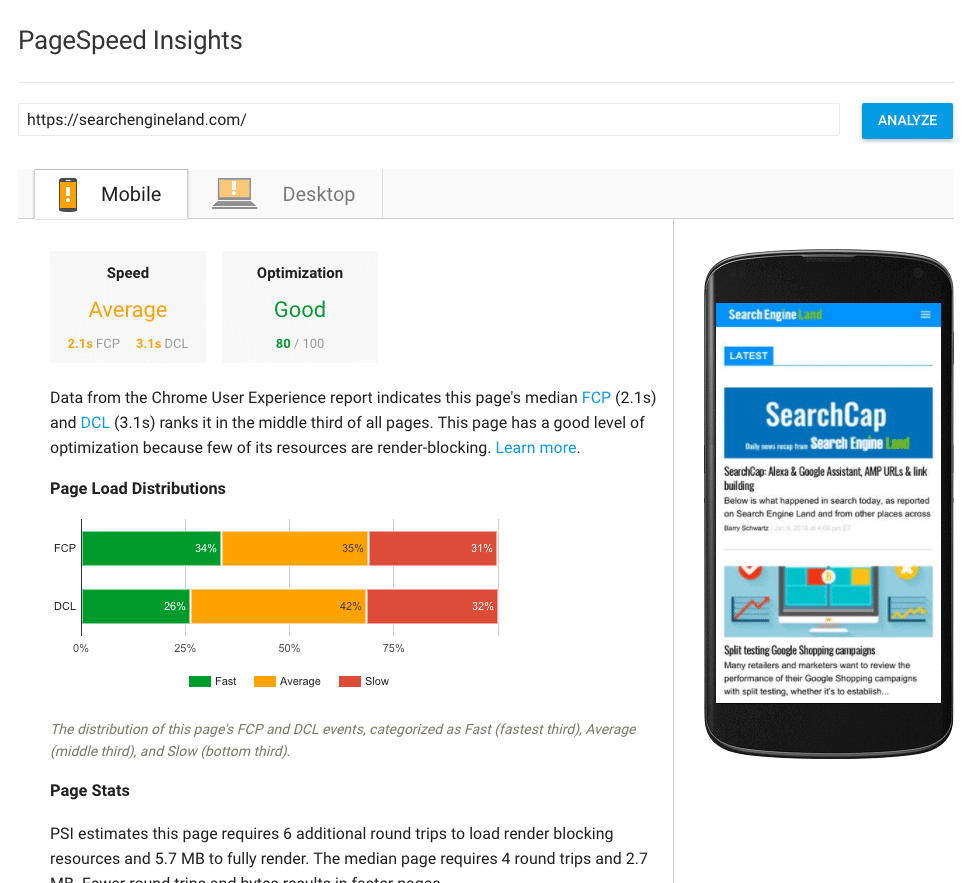
On the picture you see two values in seconds.
The first FCP (First Contentful Paint) is determined by the time it takes the user to receive a visual response to their browser (the site begins to display its content). Faster time means less waiting – therefore more likely to remain engaged and less likely to decide that he is no longer waiting and to open another site.
This time depends mainly on the connection of the server, the size of its head part and the presence of rendering blocking elements in it. Delaying them and reducing the size of the head or using HTTP / 2 server push can severely reduce this time and increase this rating.
The second DCL (DOM Content Loaded) determines when the HTML of the site is fully loaded and rendered. This is one of the factors that influence the Bounce Rate of the pages – faster loading of useful content is important for whether the user will wait for it or decide to look for other such content somewhere else.
The graphs below the estimates show the statistical results as a percentage of the indicators described over a period of time
What percentage of page loadings have recorded results that meet the criteria for fast, medium, and slow loading.
For FCP for the time being, they are set at 1.6 seconds fast, 3 seconds for average fast start times, and over 3 seconds for slow.
For DCLs, these are 2.1 seconds for fast, 4.2 seconds for medium, and over 4.2 seconds for slow page load.
It must be borne in mind that there are a number of factors that influence these results. For example, when the server or network is temporarily overloaded, these times may increase. Factors that affect system performance, such as hacking, updates, or maintenance actions, also affect these times. It is for these reasons that GOOGLE may have decided to take the result (most likely the ranking result) of an average of these results.
On the one hand, the data shown is as real as possible. On the other hand, the instantaneous data of these values cannot be estimated in the test itself. If you need this momentary data, we would advise you to contact GTMerix.
The last new item (Page Statistics) shows the page size in MB and the number of additional, bidirectional data feeds required to load image blocking resources (if you haven’t fixed it as an error), as well as the average values of these dimensions for other pages crawled by GOOGLE.
Optimization suggestions don’t seem to have changed at this time.